This simple tutorial aims to show you how Firebug can not only give you a better understanding of the application under test, it can also help you write better scripts.
 I have always enjoyed introducing people to tools that I find really helpful, and one such tool is Firebug. While this Firefox plug-in has many great features, the one that interests me the most is the Net Panel. This tutorial is targeted towards a performance tester. This simple scenario aims show you how Firebug can not only give you a better understanding of the application under test, it can also help you write better scripts.
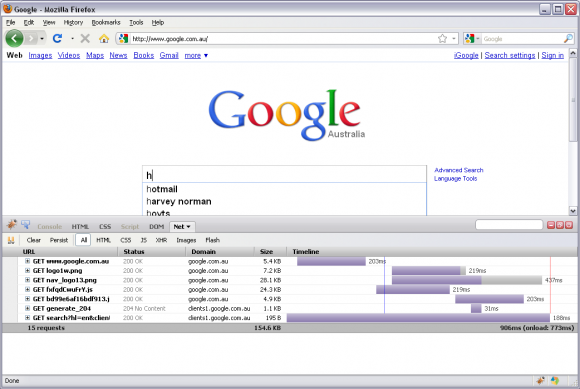
Let’s start by requesting the Google homepage. With the Net Panel in Firebug, we can see the resources that are being downloaded to create the page, their URL, size and time taken to download.

In the example image above, we can see our GET request for the URL, which returns our HTML. We then get 2 images, 2 JavaScript files and a call to generate a 204 request. A closer look at the GET request shows our HTTP headers for both the request and response.

This is all well and good, and this type of information can be found in any Firebug tutorial. What I want to discuss is that as Performance testers, we should be looking at how the application behaves in terms of impact on the server.
Let’s say your business has asked you to determine the performance of your search page, and say your company is a small web search provider called Google. What will they want to know?
- How long to launch the search page
- How long to search for a term
They have also implemented a fancy new feature that displays suggested search terms. They will probably want to know what kind of impact this will have.
So we open VuGen, record a scenario with three transactions.
- Open Search Page
- Enter Search Term
- Submit Search Query
If you simply record and playback you will notice that the Enter Search Term transaction you have recorded is empty. So how can a tool like Firebug help?
Open up Firebug and see what happens if we type in a letter into the search field?
We now have a new request. This request is a GET request for the search page on clients1.google.com.au. This is to retrieve the suggested search items displayed in the drop down. This request is repeated for each letter that is typed.

Our performance tools may not pick up this type of client side invoked behaviour very well. In fact, LoadRunner 9.1 groups these requests along with the initial page request, like a JavaScript or image. Here is the code if you just record this scenario in VuGen.
web_url("www.google.com.au",
		"URL=http://www.google.com.au/",
		"Resource=0",
		"RecContentType=text/html",
		"Referer=",
		"Snapshot=t1.inf",
		"Mode=HTML",
	EXTRARES,
		"Url=/images/dl_btn_mid.gif", ENDITEM,
		"Url=/intl/en_com/images/logo_plain2.png", ENDITEM,
		"Url=/extern_js/f/CgJlbhICYXUrMEU4ASwrMFo4ASwrMA44ESwrMBc4BywrMCc4BCwrMDw4AywrMFE4AiwrMAo4bUAdLCswFjgcLCswGTghLCswJTjKiAEsKzBAOBIsKzBOOAUsKzAYOAUsKzAmOAssgAIN/NruCKo30NSw.js", ENDITEM,
		"Url=http://clients1.google.com.au/complete/search?hl=en&client=hp&expIds=17259,18168,23756,24472,24878,25013,25115,25233,25299,25335,25363,25368&q=t&cp=1", ENDITEM,
		"Url=http://clients1.google.com.au/complete/search?hl=en&client=hp&expIds=17259,18168,23756,24472,24878,25013,25115,25233,25299,25335,25363,25368&q=tes&cp=3", ENDITEM,
		"Url=http://clients1.google.com.au/complete/search?hl=en&client=hp&expIds=17259,18168,23756,24472,24878,25013,25115,25233,25299,25335,25363,25368&q=te&cp=2", ENDITEM,
		"Url=http://clients1.google.com.au/complete/search?hl=en&client=hp&expIds=17259,18168,23756,24472,24878,25013,25115,25233,25299,25335,25363,25368&q=test&cp=4", ENDITEM,
	LAST);
So what has VuGen done wrong? (Other than record the requests in the wrong order).
Namely, it has not allowed us to separate these calls and record their response times. Worse still, if we were were comparing our open search page transaction with a version that did not contain this feature, we would be incorrectly reporting an increase in response times for this page.
Using Firebug, we have seen that the calls to http://clients1.google.com.au/complete/search are triggered with each letter typed into the search field.
Our code for the suggested search should therefore look something like this
suggestedSearch(char *searchTerm) {
int i;
char progressiveSearch[1024] = {0};
for(i=0; i
While this is a very simple scenario, I think it provides a great example of how a tool like this can be a great addition to your arsenal. While the easy installation of this Firefox plug-in makes it very accessible, unfortunately for those in a locked-down corporate environment the lite version doesn't include the Net Panel as its "too dependent in browser internals". If you are looking for an alternative, HttpWatch Basic Edition is a free tool that does play well with Internet Explorer.
There are also some other functions of the Firebug Net panel that are useful, one is the ability to quickly disable the browser cache allowing you to easily see which components of a web site would be cached and which would not.
This is where this tutorial should end, however, I can't in good faith finish this example without some clarification. If you look closer at the way Google deals with typing in search terms quickly, not every letter typed will create a request. The word "test" typed quickly would create 2 requests, one for "te" and one for "test" and not the 4 in this example.
As with all automated testing, the devil is in the details. It's vital to understand the application under test. To look through the statistics provided, how many suggested searches are one letter at a time, how many are typed quickly, how many are pasted into the search window and only make one request.
Hopefully this gives you some insight into how to use a tool like Firebug to become a better performance tester.


